Build It, Then Graph It
I like graphs. Not the quarterly kind, but the kind where a short formula goes
into a plotter and something unexpected comes out: humps of different heights,
flat shoulders where the curve pauses and carries on, a pattern you did not
ask for. The trouble is getting the formula in. On a phone,
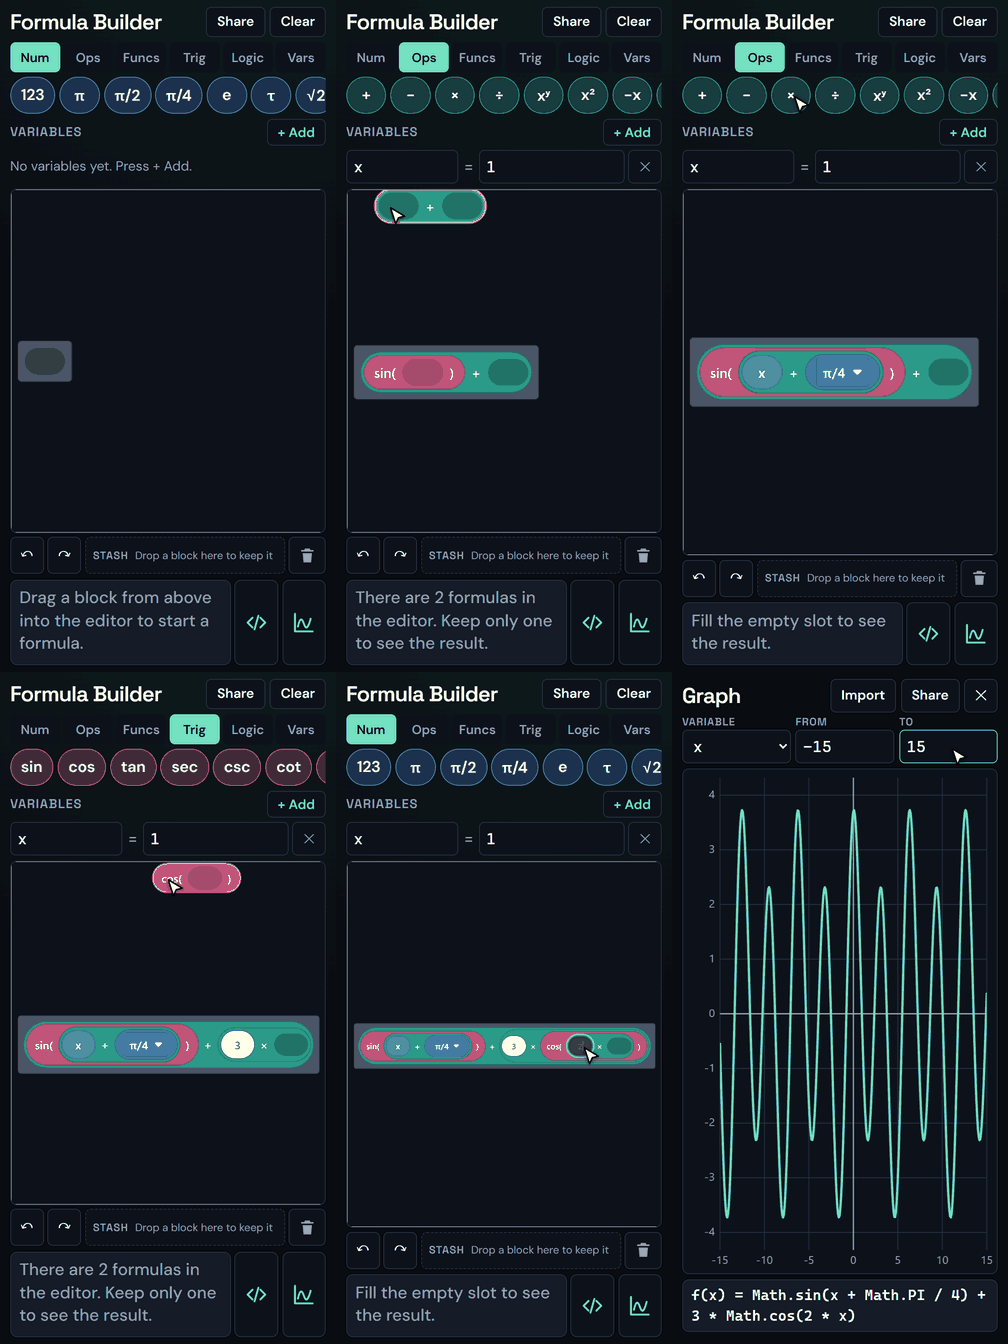
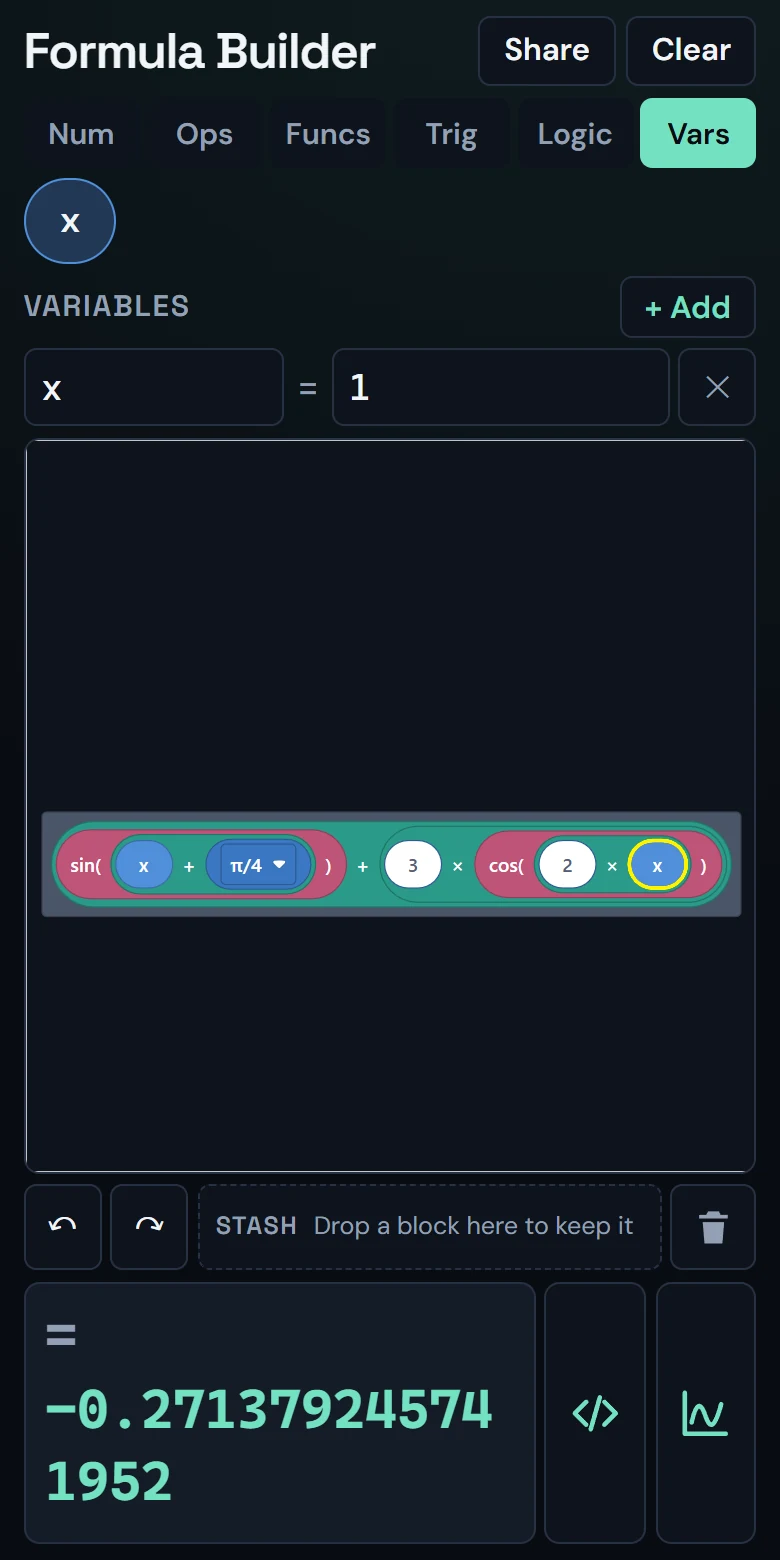
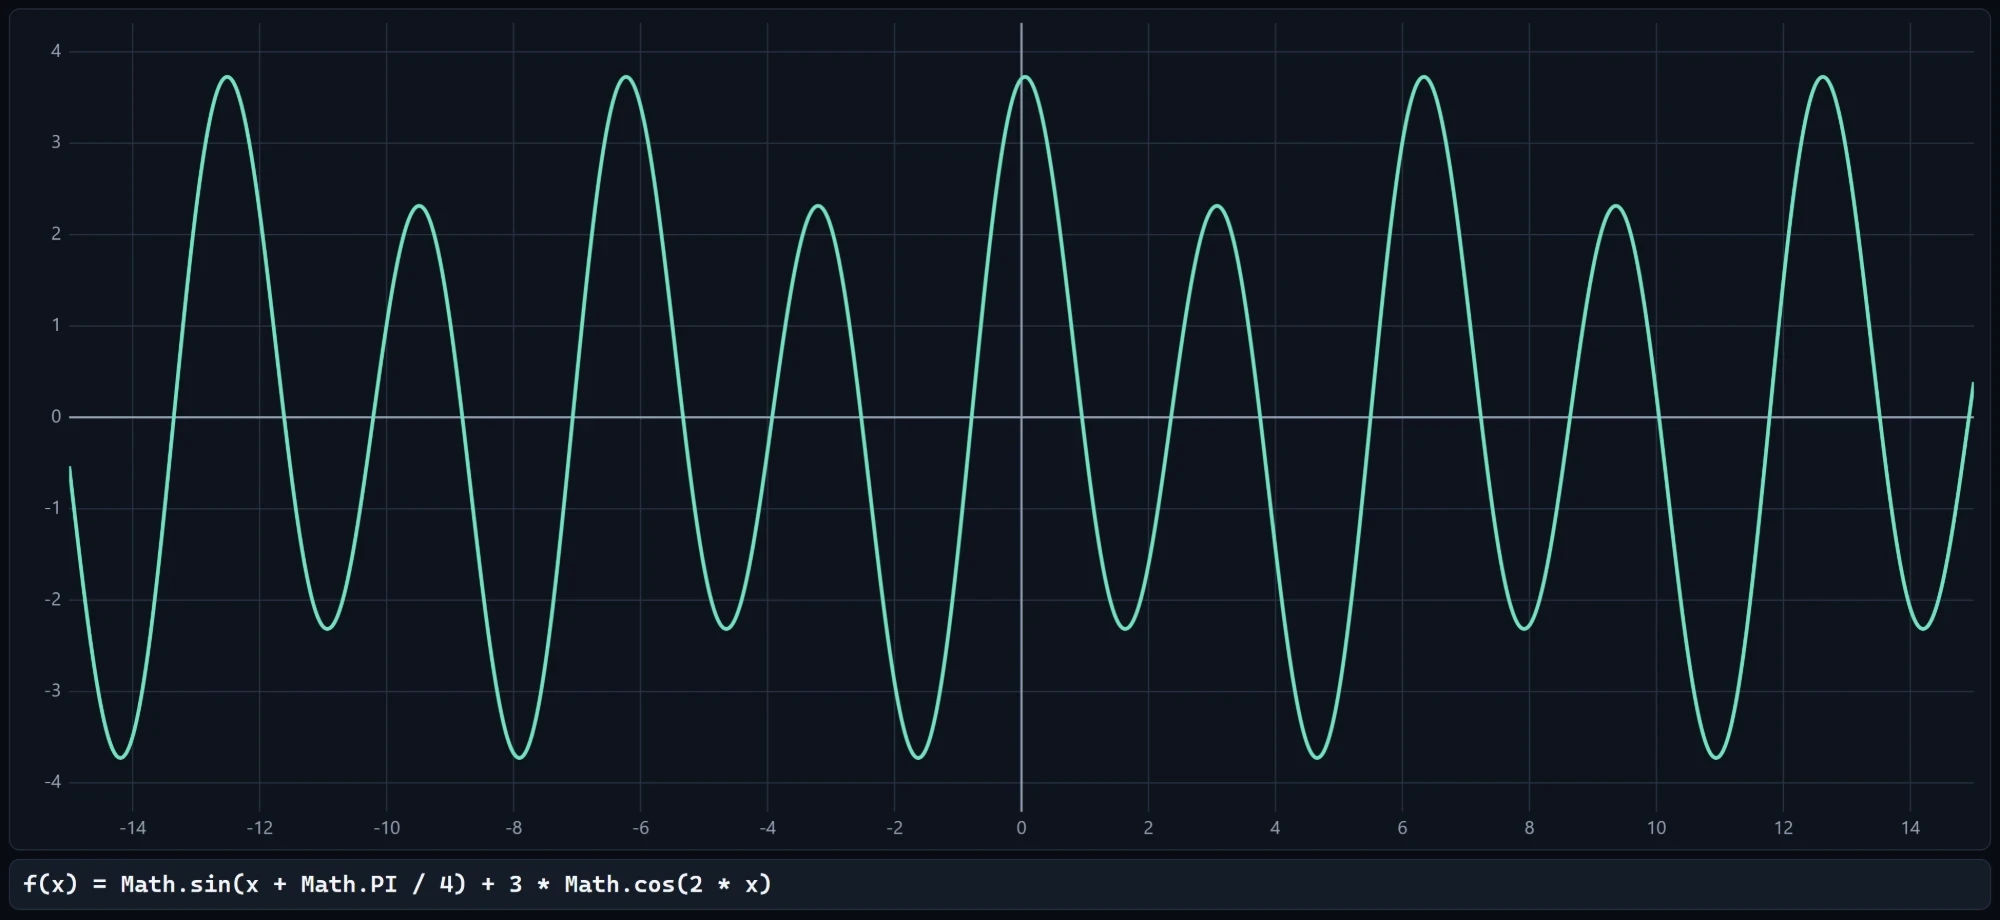
Math.sin(x + Math.PI / 4) + 3 * Math.cos(2 * x) is a contest against tiny
keys and brackets that never balance.
So I built the Formula Builder. You assemble the formula from blocks by
dragging them into place, and one button draws it.
Snap it together
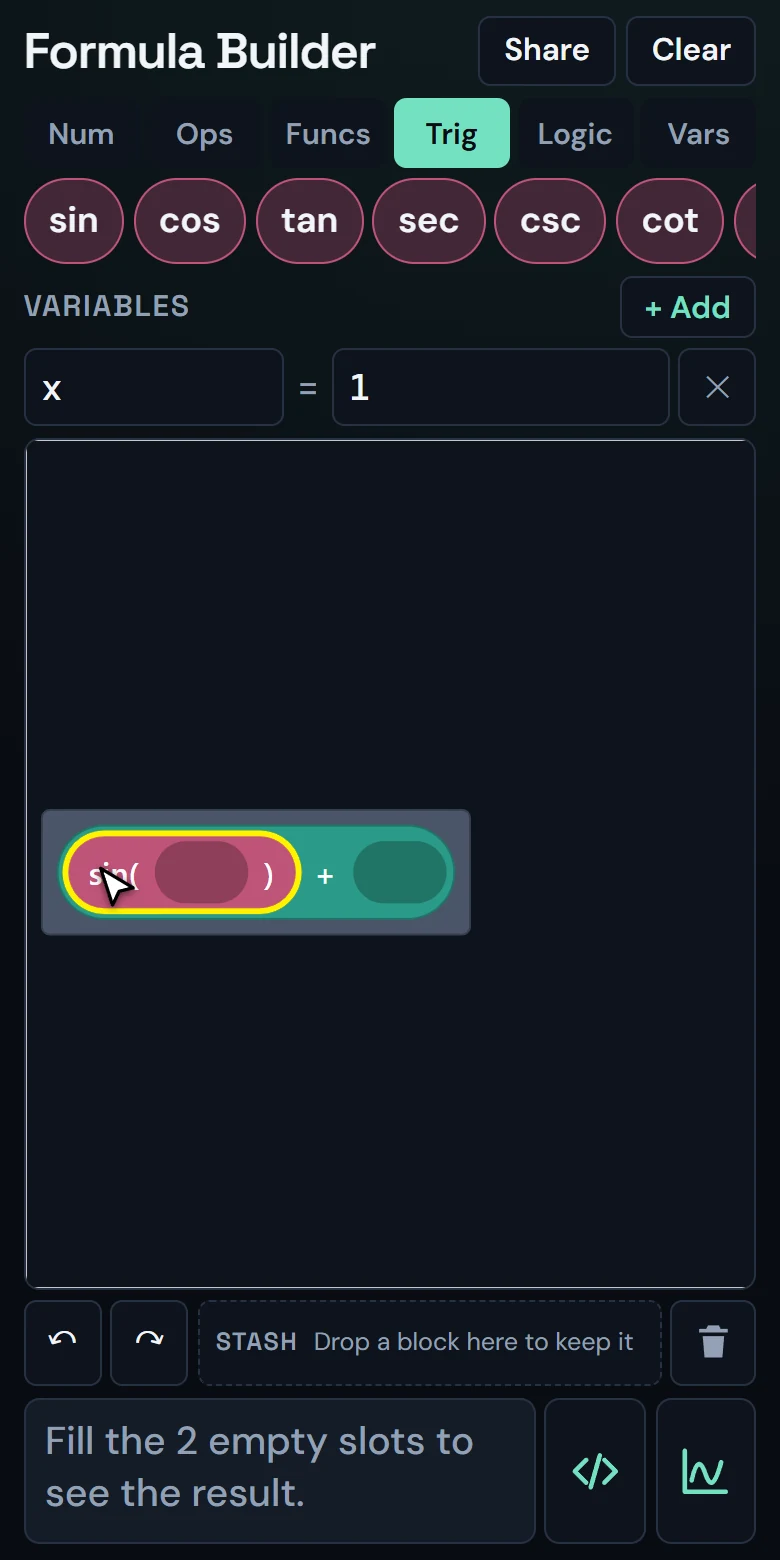
Along the top there is a strip of tabs: numbers, operators, functions,
trigonometry, logic and your own variables. Pick a tab, drag a block out of the
strip, and drop it on a slot. That is the whole interface. Blocks only fit where
they make sense, so you cannot build something broken, and there are no
parentheses to count. The app adds the right ones.
The clip below builds the formula above from scratch. It is the real app,
recorded at three frames per second, so the dragging is a little jerky.
The only thing you ever type is a digit, when a number block needs to say 3
instead of 0. Constants such as π, π/2 and π/4 are blocks of their own, one
drag away. As soon as every slot is filled, the value appears at the bottom, and
it follows any change you make, because there is no calculate button.
Two waves, one sum
Everything below comes from the same few moves. I began with the plainest
thing there is: a fast wave plus a slower one.
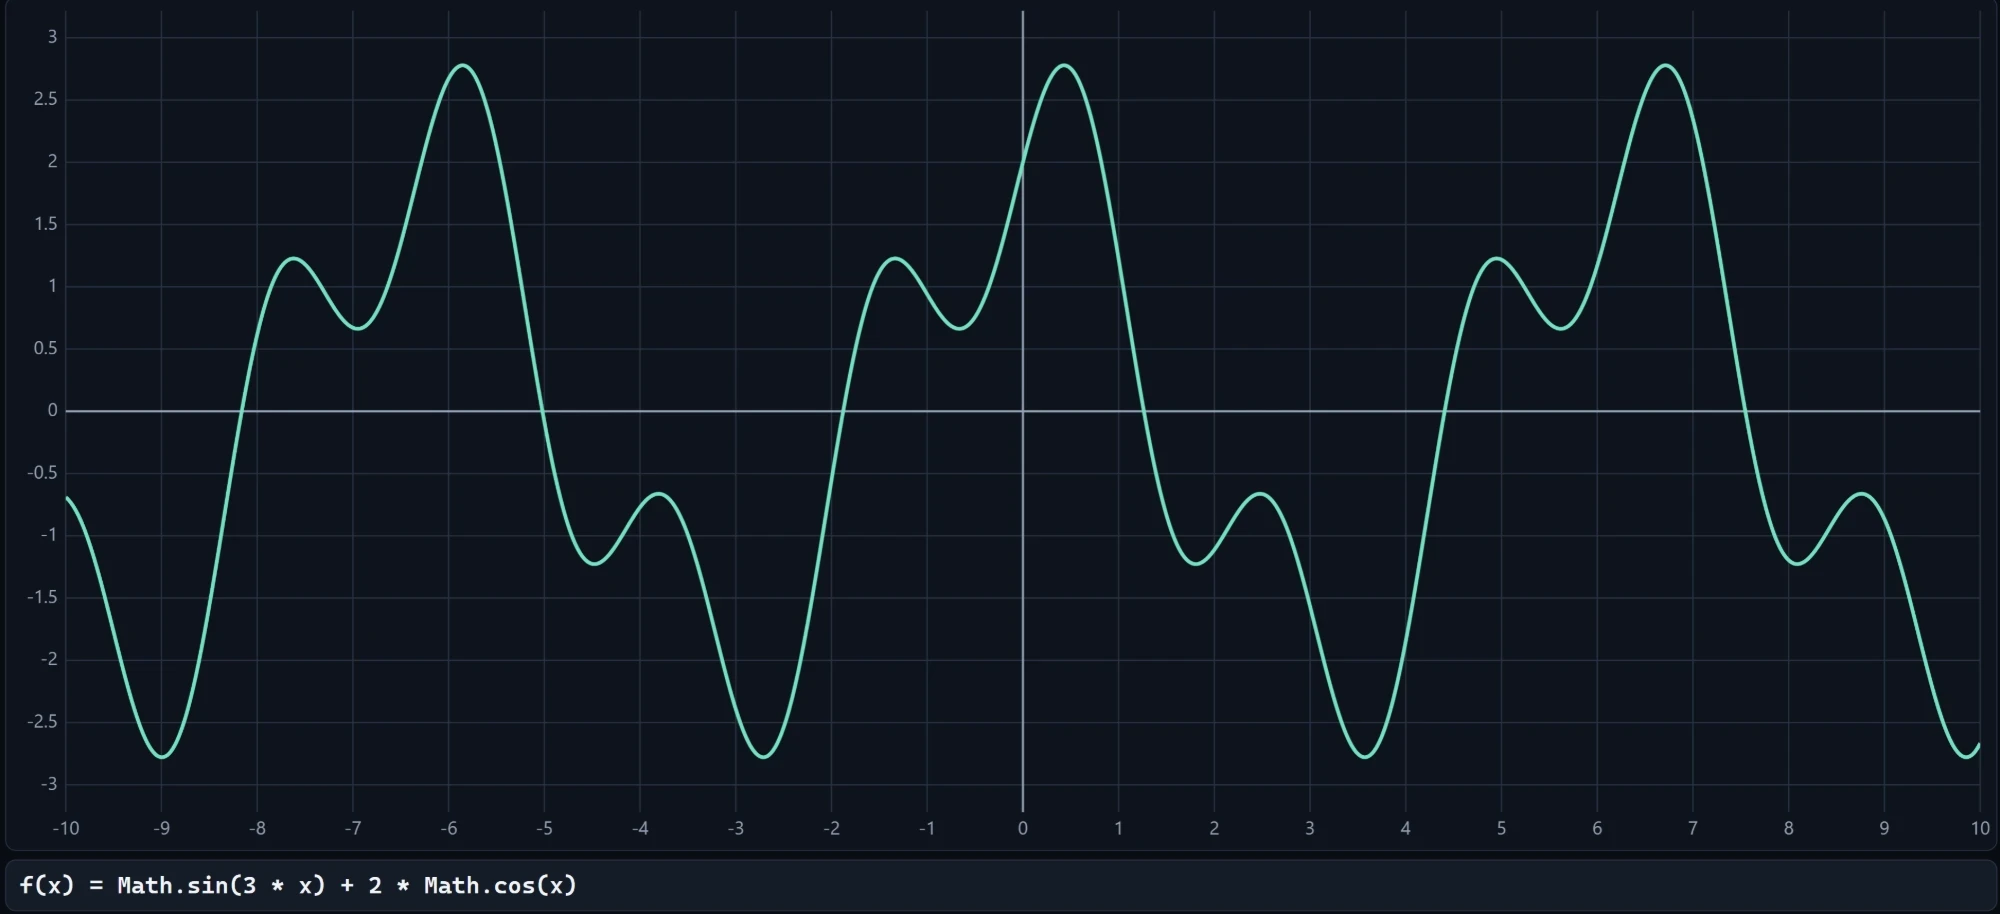
sin(3x) + 2cos(x) repeats every 2π, and each period holds three peaks of
three different heights. One of them hides below the axis. Already it is hard
to guess from the formula what the picture will look like.
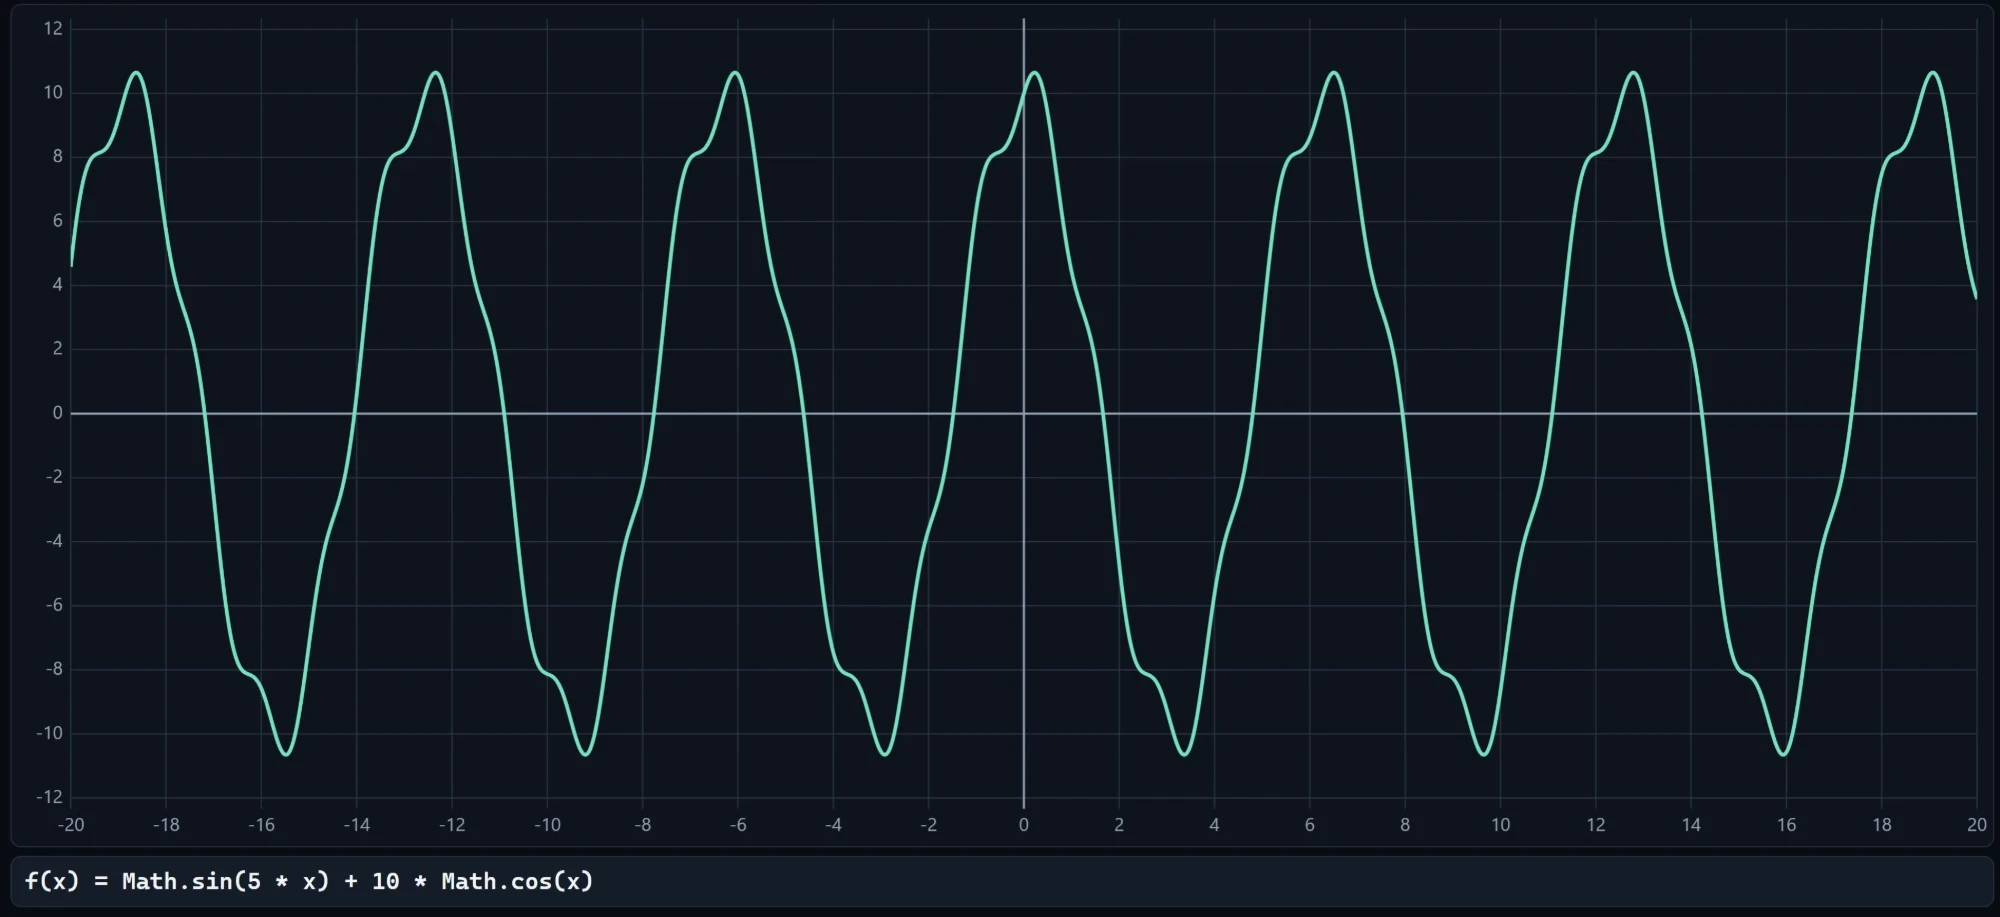
Now let the slow wave win by making it ten times as big:
sin(5x) + 10cos(x) has only one peak and one trough per period. The fast
wave has shrunk to a ripple, but it has not vanished. It shows up as shoulders
on the flanks, short flat steps where the curve slows down, hesitates and then
keeps falling. These are inflexion points without a turning point, and they are
my favourite part of this picture.
A wave inside a wave
Blocks nest, so nothing stops us from putting a function inside another one.
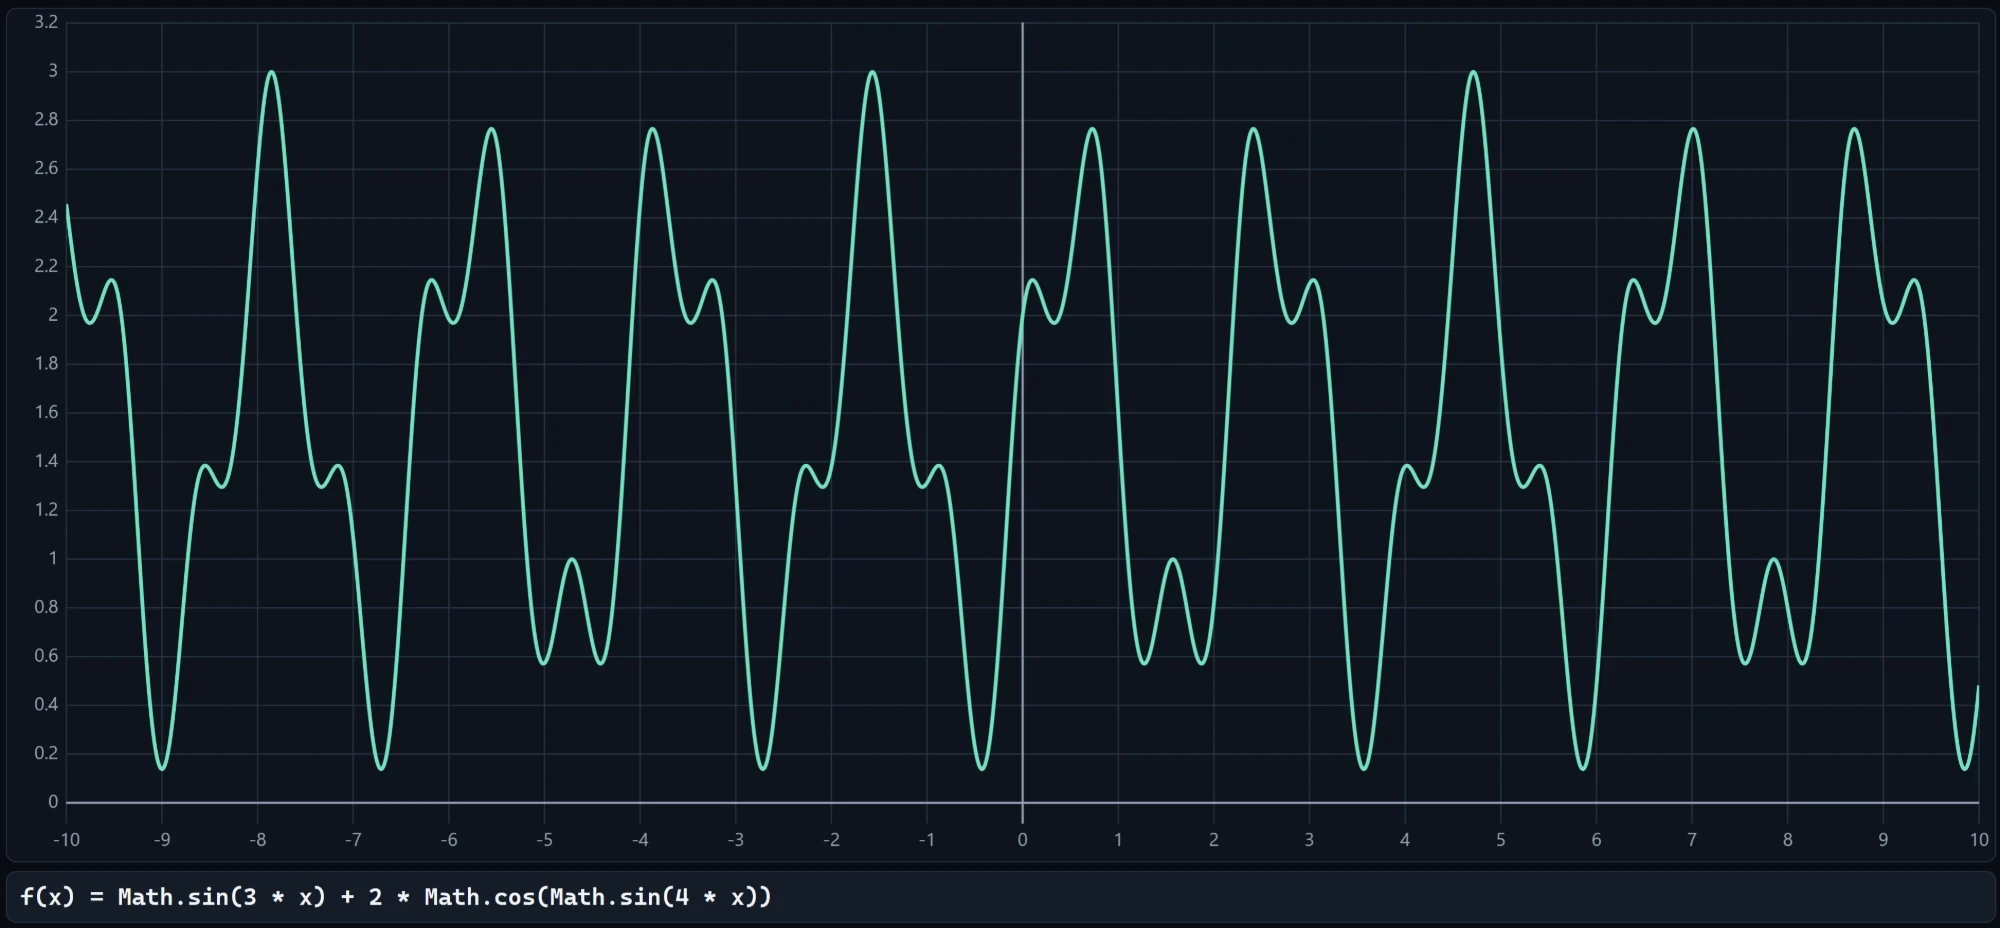
In sin(3x) + 2cos(sin(4x)) the inner sin(4x) only ever lies between
-1 and 1, so 2cos(...) is stuck in a narrow band between about 1.1 and 2.
Add sin(3x) to that and the whole curve stays above zero and tops out at
exactly 3. Inside that corridor it still manages to squeeze in a lot of wiggles.
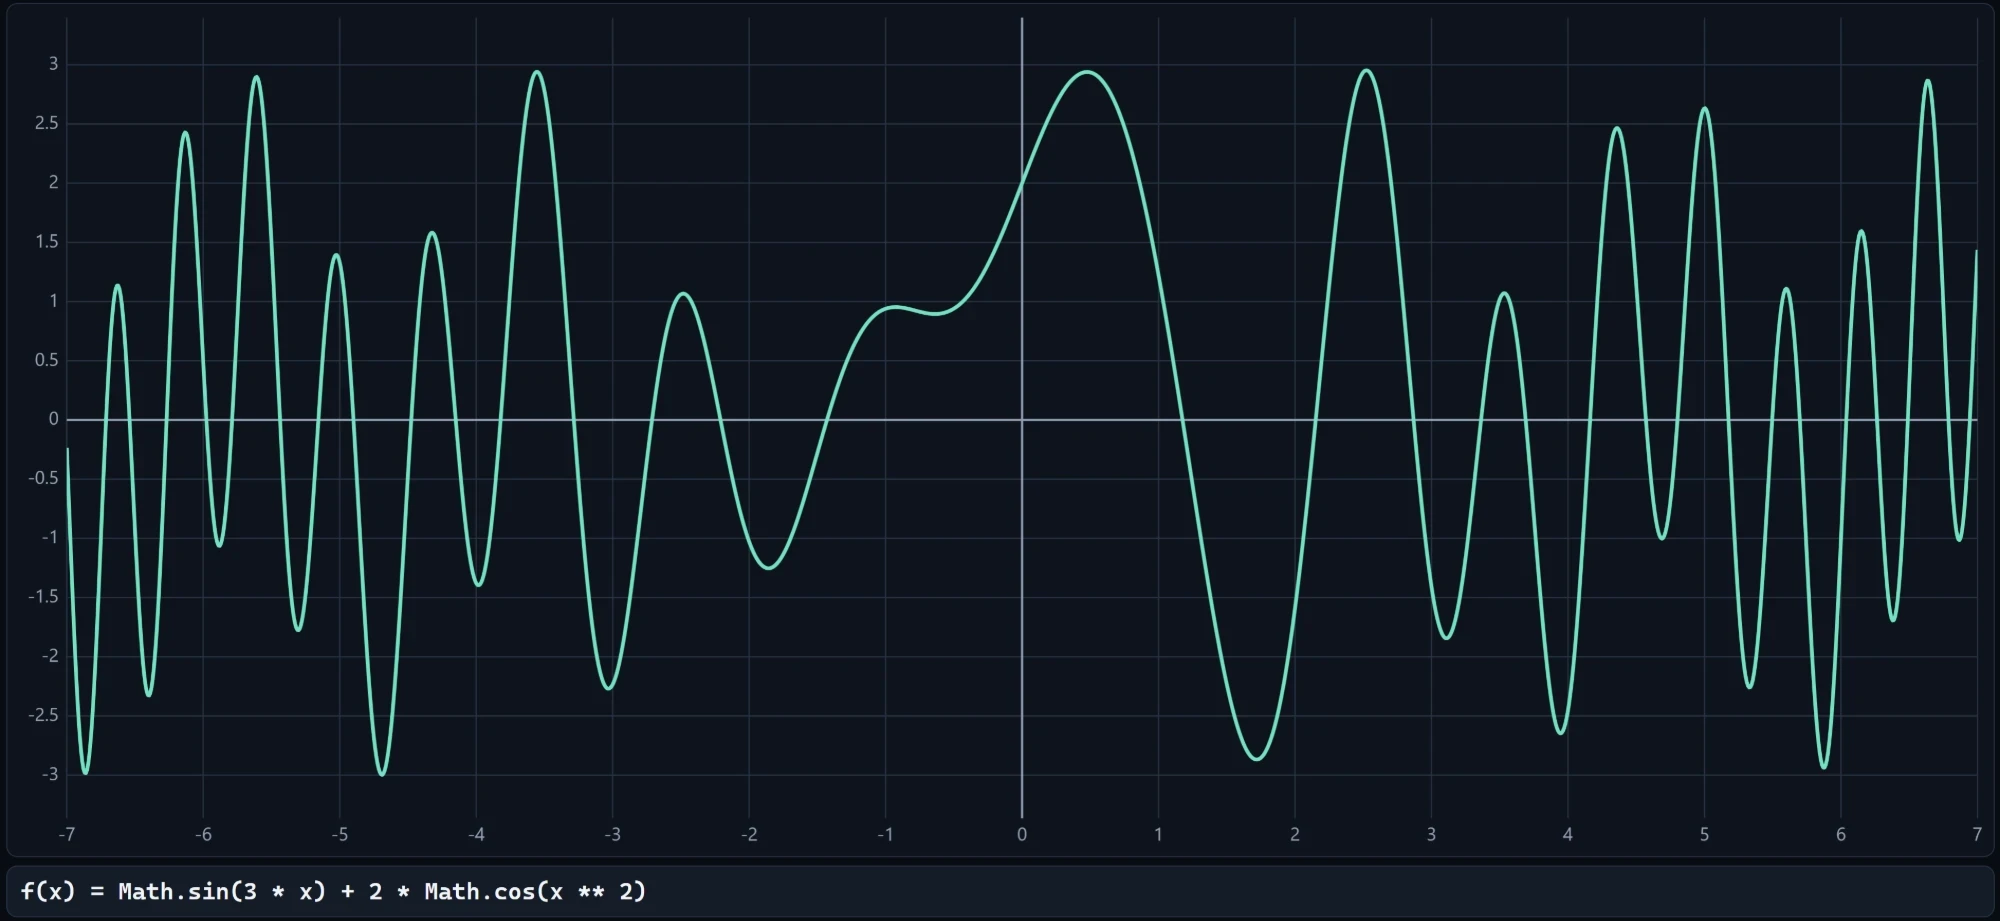
Replace the inside with something that keeps growing and the curve speeds up as
it goes:
In sin(3x) + 2cos(x²) the argument of the cosine changes faster the farther
you are from zero. Near the middle it hardly moves, and the slow sine shows
through, with a flat pause around x = -1. Toward the edges the oscillation
speeds up and the peaks crowd together, like a siren.
Turning the volume up and down
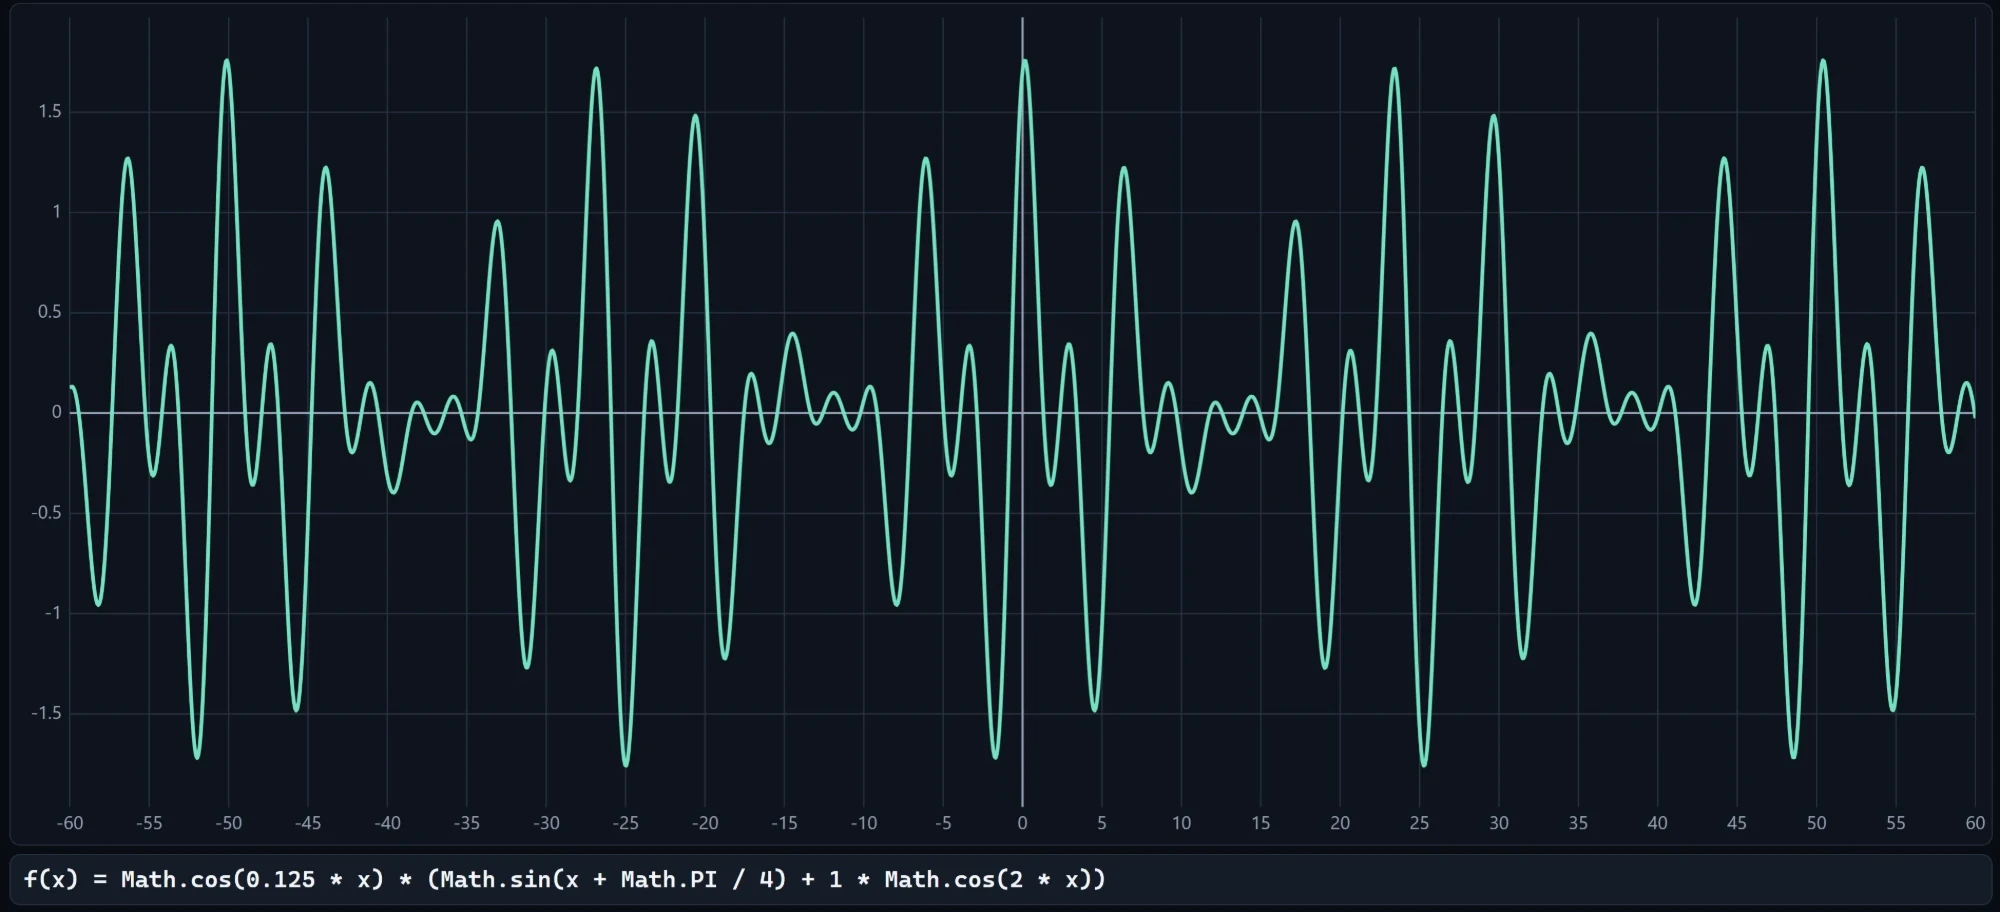
Multiplying by a slow cosine gives the whole curve an envelope: the amplitude
swells and fades, the way two guitar strings tuned almost alike beat against
each other. Here the factor is cos(0.125x), and the wave from the clip, now
with a plain 1 * cos(2x), sits inside.
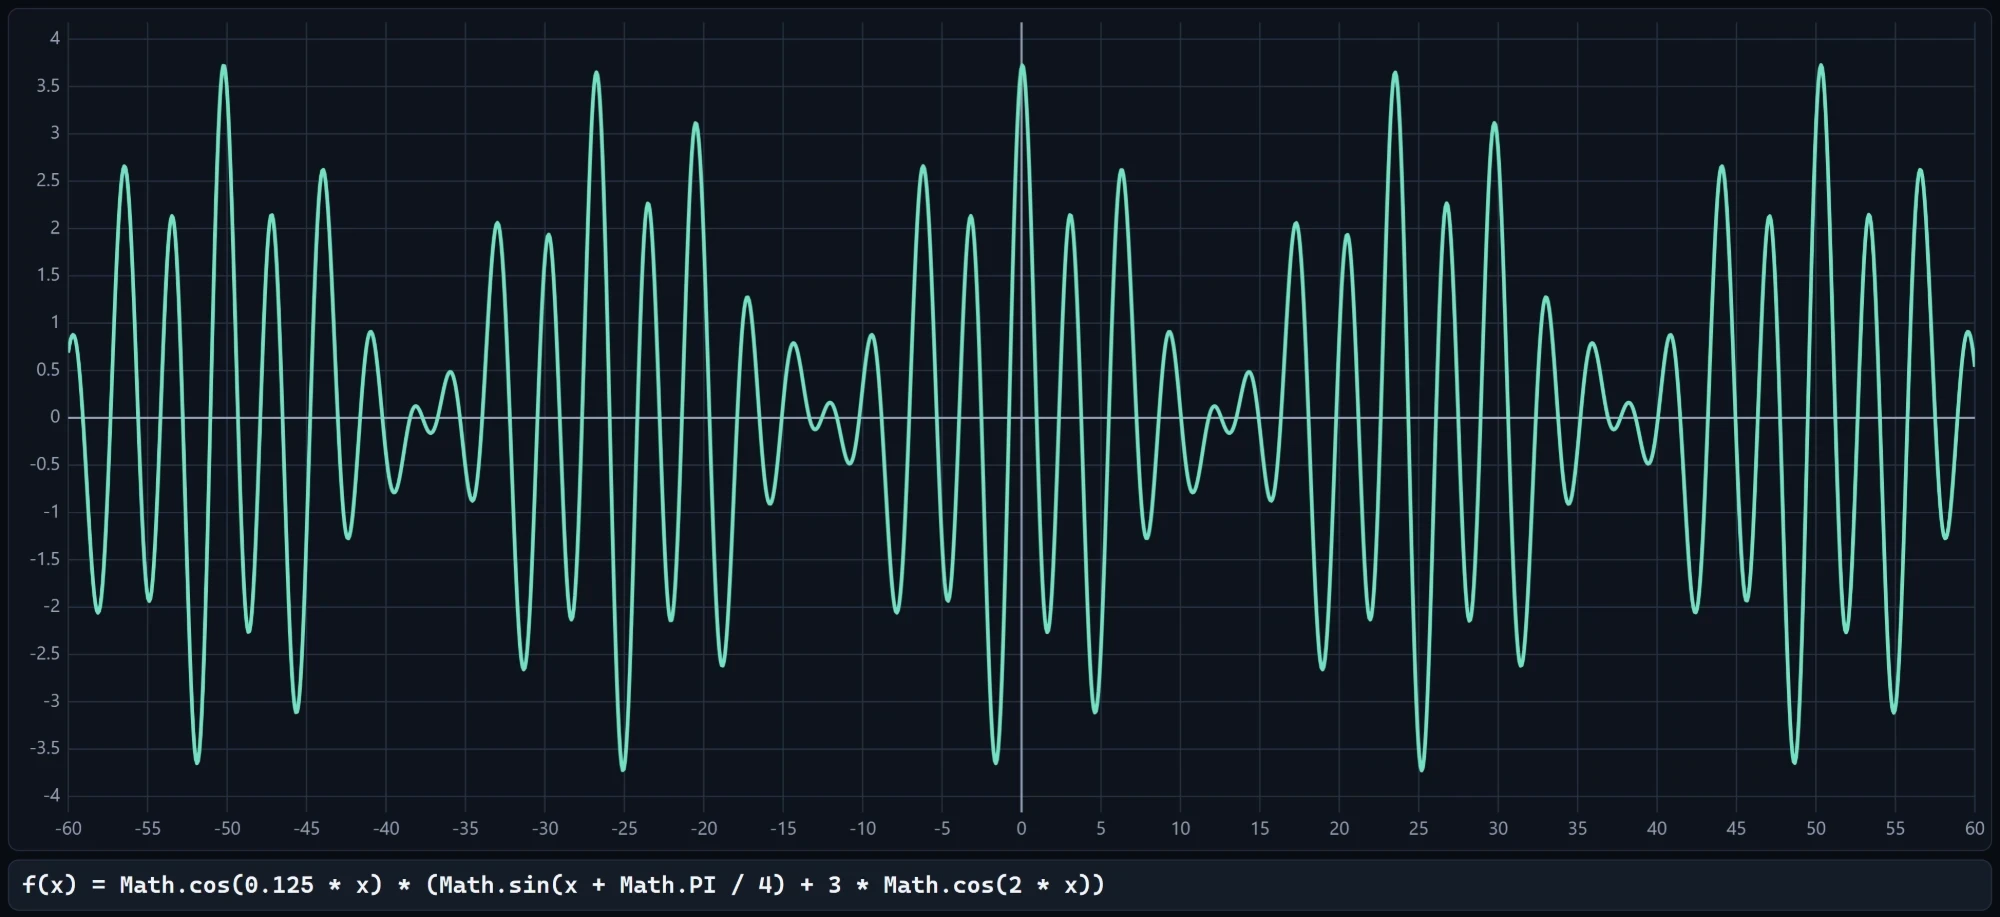
Change that 1 into a 3 and the same envelope carries a much busier wave, with
dozens of peaks and dips in this window:
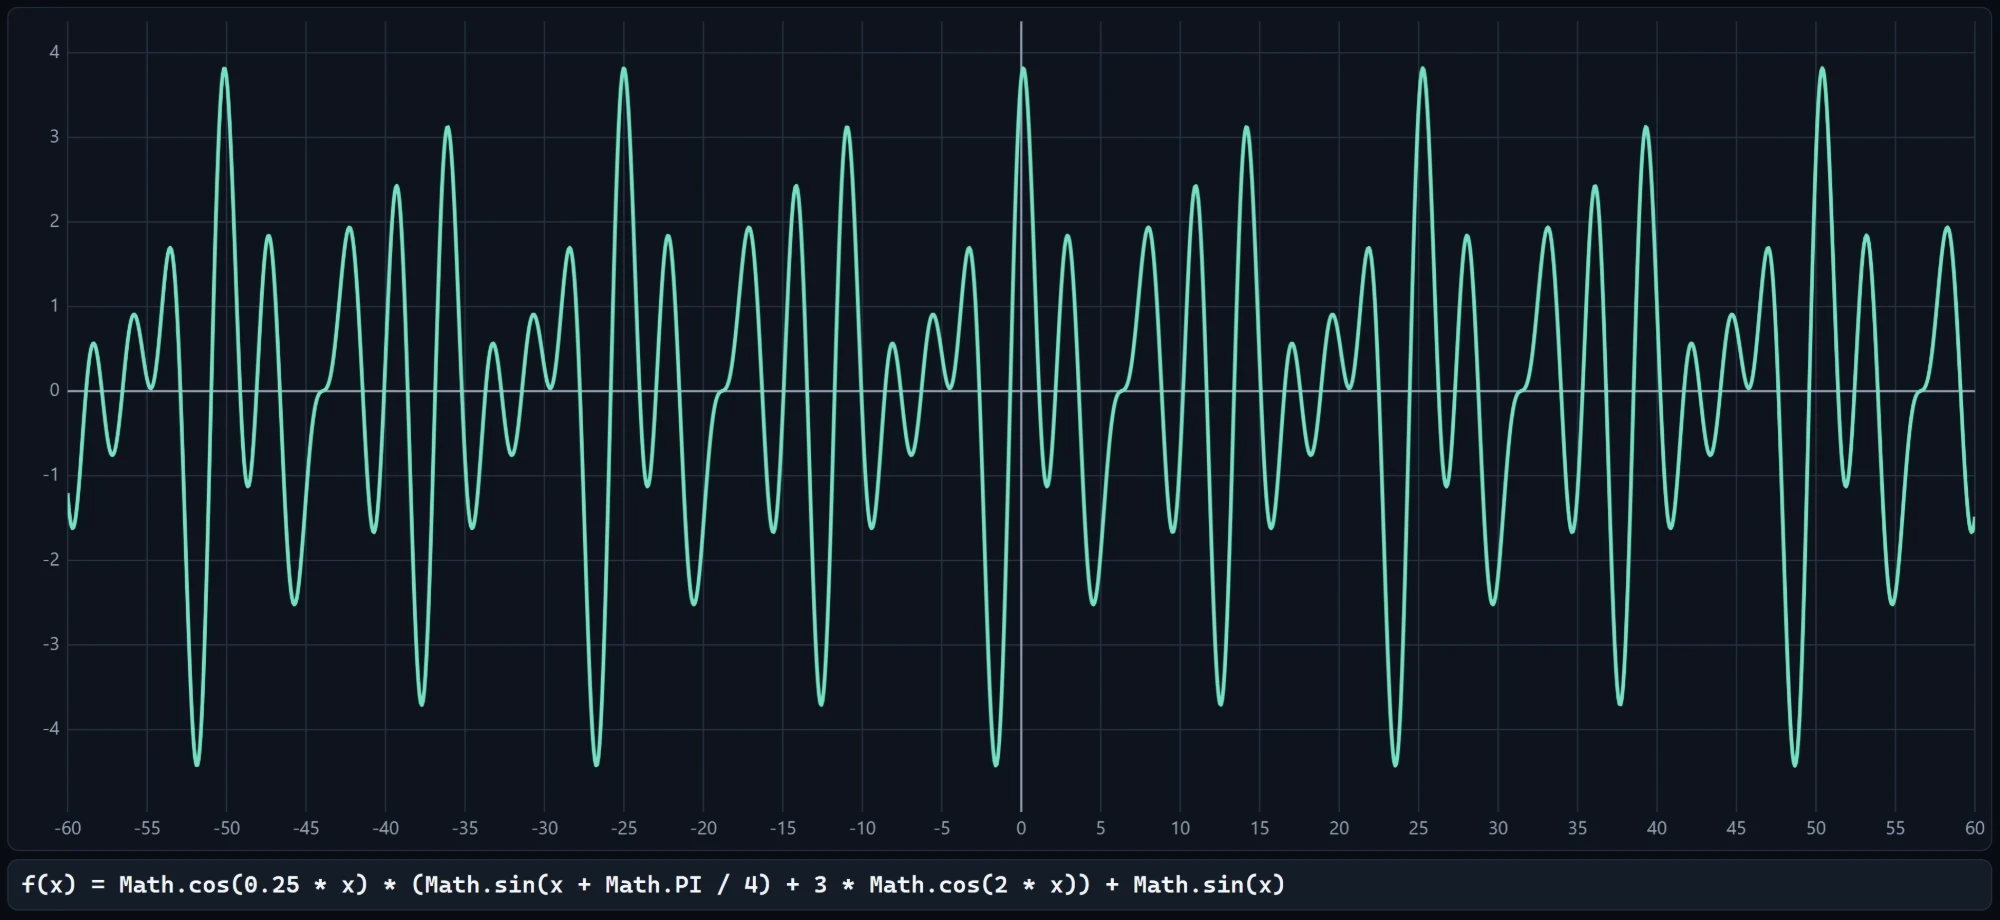
Add a plain sin(x) on the end and the symmetry around the vertical axis is
gone. The dips now reach deeper than the peaks do, and the quiet stretches are
no longer quiet, because sin(x) keeps going while the envelope fades:
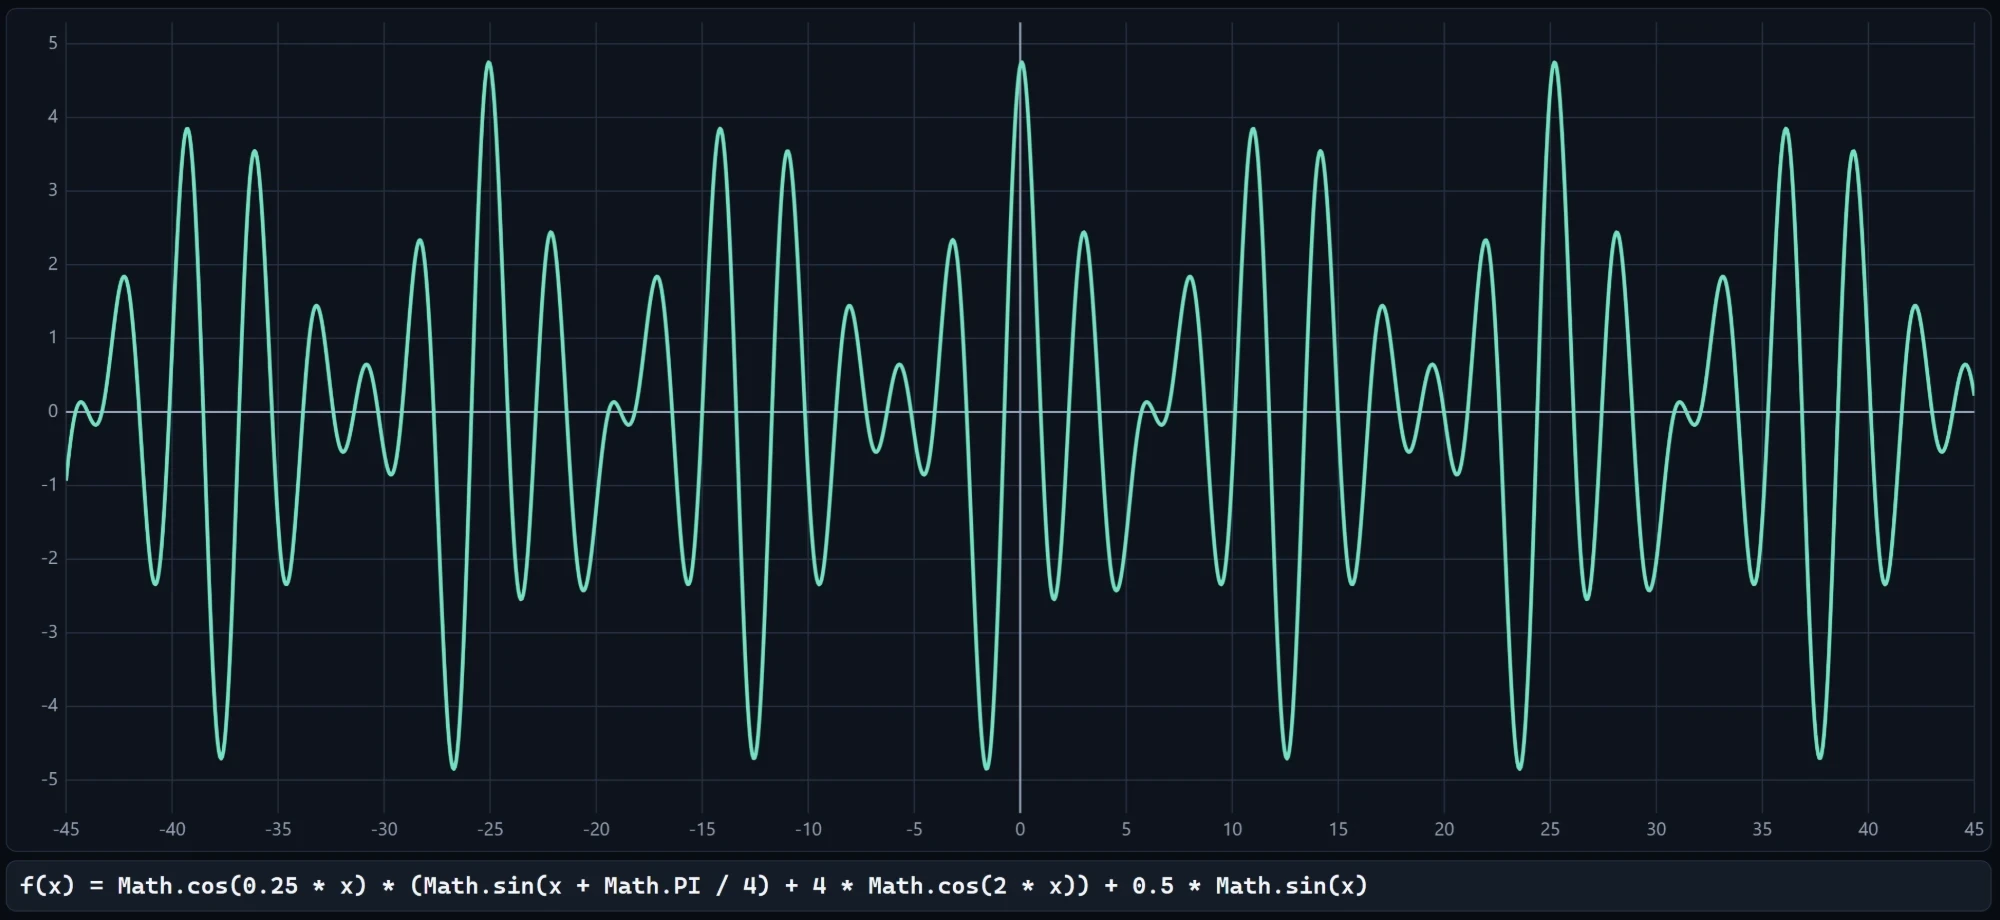
From there it is a matter of nudging numbers. Each tweak is one tap on a number
block and one glance at the graph. A 4 here and a 0.5 there give this:
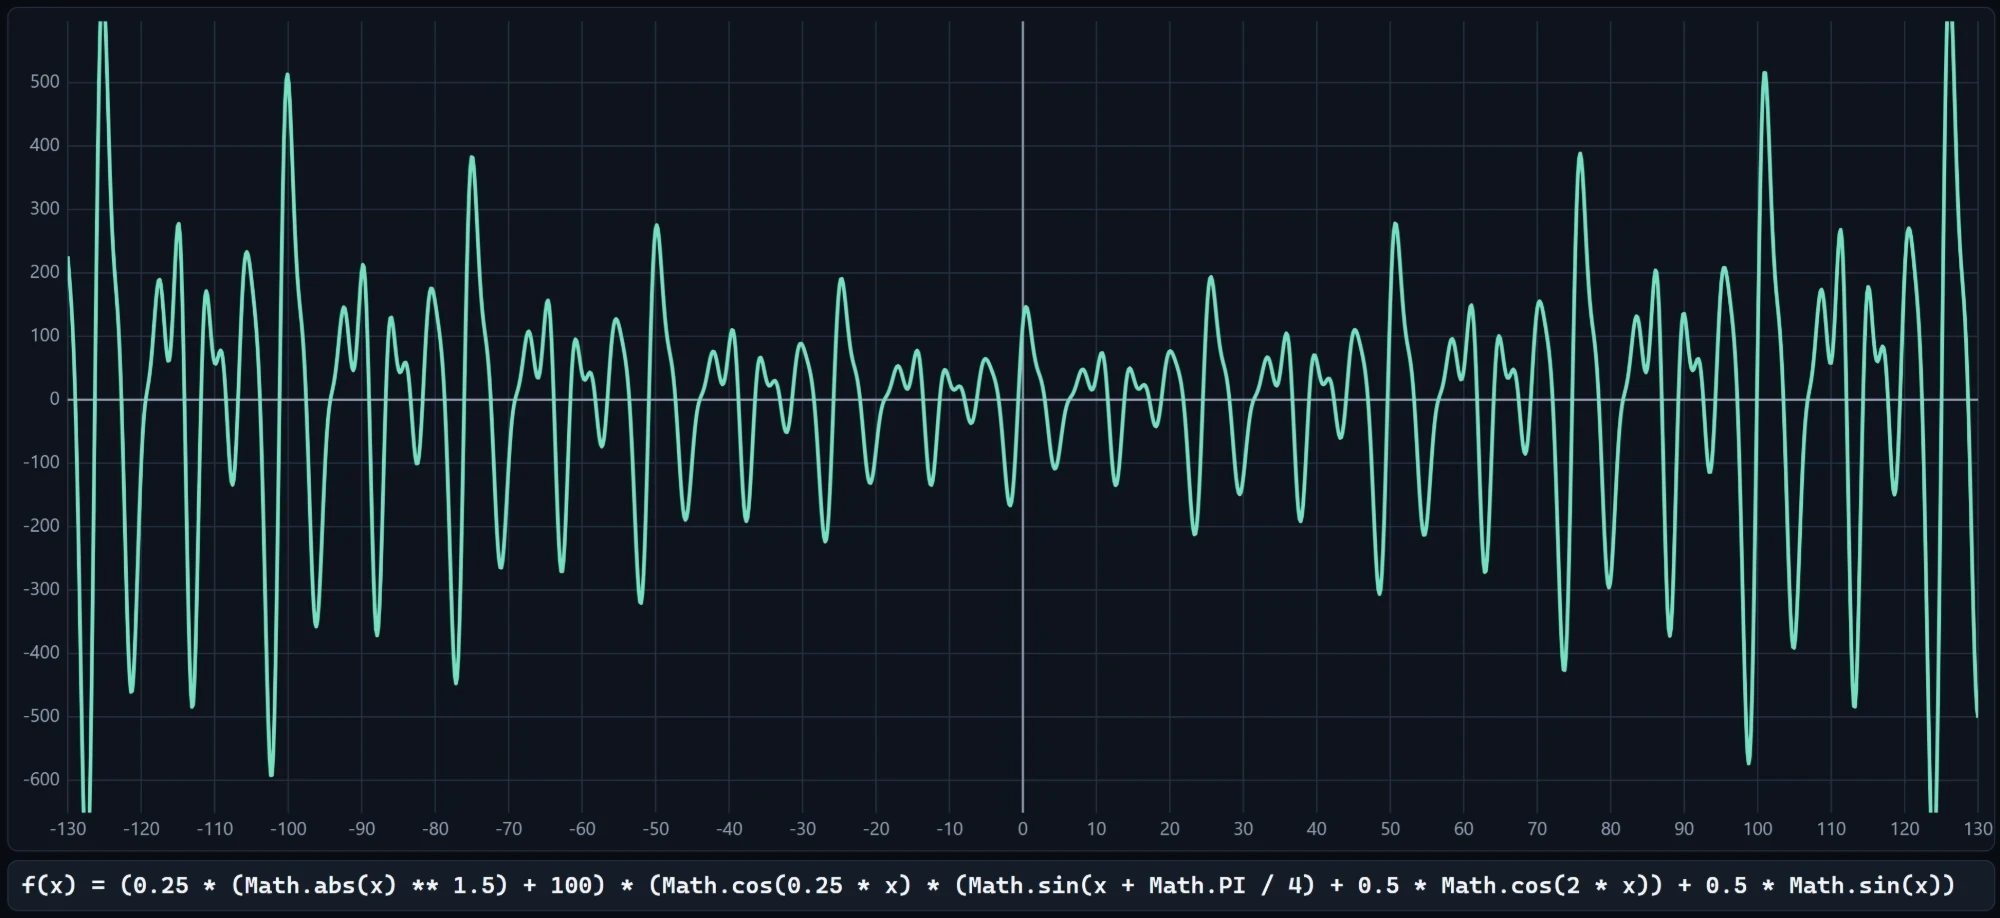
The last one is the most elaborate, and it is still only blocks and a few
digits. It scales everything by 0.25 * |x|^1.5 + 100, so the swings grow toward the
edges. The tallest peaks are even cut off by the frame.
Try it
It lives at formulas.raz.sg. Add a variable, drag a
sine onto the editor, and keep going until the curve surprises you. There is
nothing to sign up for, and everything happens on your device. If you find a
curve you like, or something breaks, find me on
LinkedIn.